
 Dansk
Dansk
 English
 Suomi
Suomi
 Español
 Deutsch
 Français
 Italiano
 Nederlands
 Polskie
 Norsk
Norsk
Varukorg
Din varukorg är tom, men det behöver den inte vara.
Rabatt: 0,00 SEK
Justin, Victron Energy |29/09, 2020
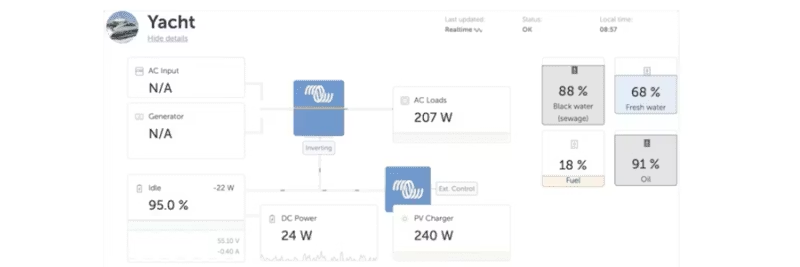
Den nya instrumentpanelen kombinerar en schematisk översikt av installationen med historisk data och visar nu information i realtid, uppdaterad varannan sekund.
Målet är att ge en komplett statusöversikt för alla typer av installationer – på en enda sida.
Den schematiska stilen känns igen från GX-enheter. Exemplet ovan visar en installation ombord på en båt med fyra tanknivåer – både i procent och visuellt med skuggade nivåer. Mer detaljerad data visas när du hovrar över grafiken.
Realtidsuppdatering kräver tvåvägskommunikation mellan VRM och installationen. Detta innebär:
För att undvika överbelastning pausas live-data automatiskt om CPU-belastningen blir för hög. Då återgår uppdateringen till det intervall som är konfigurerat på GX-enheten.
Obs: Om VRM-portalen är öppen i en flik som inte är aktiv, pausas live-rapporteringen efter en minut.