
 Svenska
 Dansk
Dansk
 Suomi
Suomi
 Español
 Deutsch
 Français
 Italiano
 Nederlands
 Polskie
 Norsk
Norsk
Cart
Your cart is empty, but doesn't have to be..
Discount: 0.00 EUR
Justin, Victron Energy |29/09, 2020
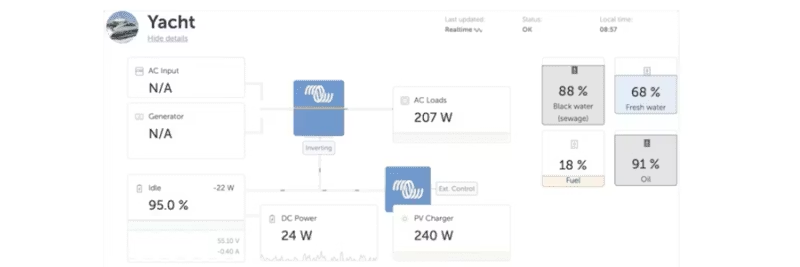
The new dashboard combines a schematic overview of the installation with historical data and now displays information in real-time, updated every two seconds.
The goal is to provide a complete status overview for all types of installations – on a single page.
The schematic style is recognizable from GX devices. The example above shows an installation on board a boat with four tank levels – both in percentage and visually with shaded levels. More detailed data is displayed when you hover over the graphics.
Real-time updating requires two-way communication between VRM and the installation. This means:
To avoid overload, live data is automatically paused if the CPU load becomes too high. Then the update reverts to the interval configured on the GX device.
Note: If the VRM portal is open in an inactive tab, live reporting is paused after one minute.