
 Svenska
 Dansk
Dansk
 Suomi
Suomi
 Español
 Deutsch
 Français
 Italiano
 Nederlands
 Polskie
 Norsk
Norsk
Cart
Your cart is empty, but doesn't have to be..
Discount: 0.00 DKK
Justin, Victron Energy |9/09, 2022
In part three of our blog series on extended features in VRM and VictronConnect, we introduce Stored Trends – a powerful tool for analyzing historical system data and optimizing your energy management.
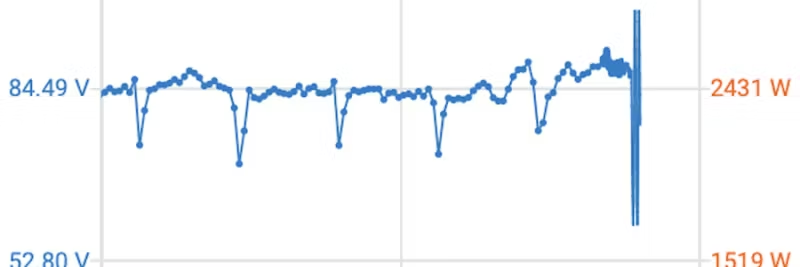
You are probably familiar with the trend function in VictronConnect which displays real-time data graphically. Now you can not only follow live data but also store and analyze history over time. This makes it possible to compare performance before and after changes in your installation.

A solar charge controller can, for example, display:

With Stored Trends, you can store data for up to 45 days – and for Smart Battery Sense, a full 180 days. You can zoom in and out with the magnification tool to analyze specific time periods. This is perfect for comparing seasonal variations, battery replacements, or capacity increases.

Analyzing real performance over time provides you with the basis for smart decisions about future system optimization. You clearly see the effect of changes and can plan for the best efficiency.